|
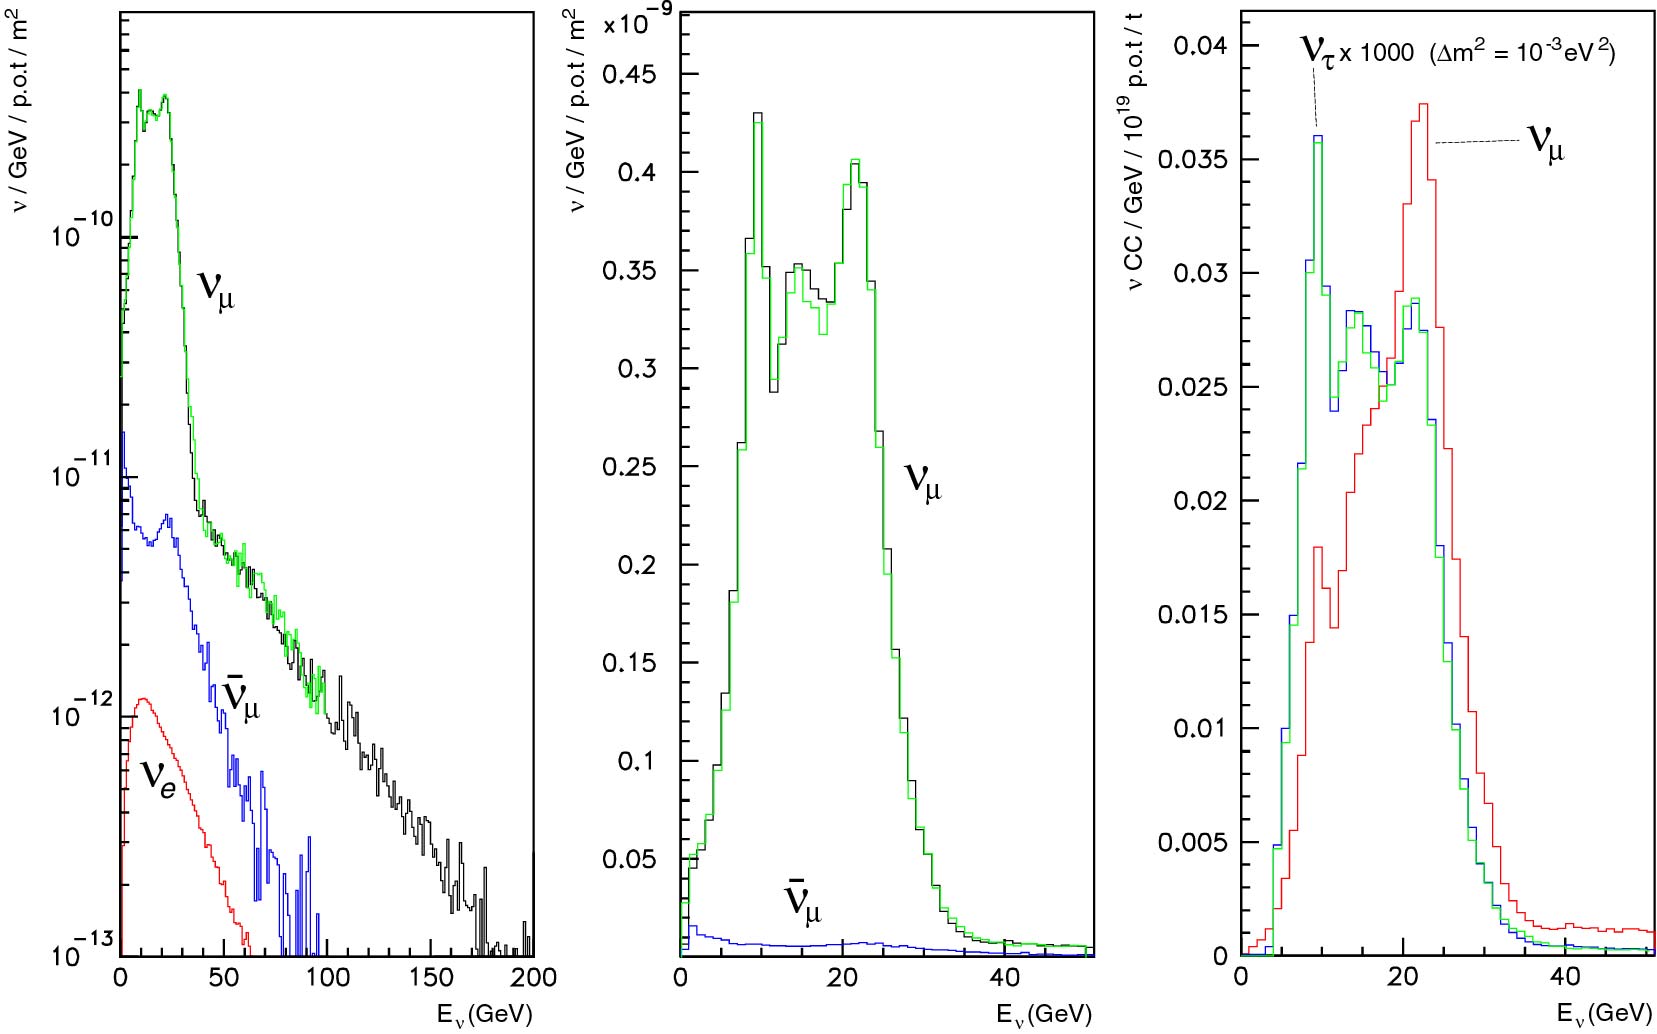
The figures below show energy distributions of the neutrino fluences
expected at Gran Sasso, in logarithmic (left) and linear scale (middle). Also shown, on
the right, are the nm and nt charged current event spectra as expected at Gran
Sasso. These spectra correspond to the latest
version of the CNGS secondary beam layout (November 2000). Numerical values corresponding to these spectra are available
on a separate page. Note that almost undistinguishable results are found with two
simulation methods: (a - green line) FLUKA99 is used for the hadron production and
GEANT3.21 for the tracking of the secondary and the decay processes leading to the
neutrino fluences, (b - black line) a parametrisation of the hadron production is used
together with a fast neutrino beam simulation code (cf. M.
Bonesini et al.). For simplicity, the two models are compared only for the main beam
compenent.
NOTE
added on 13 April 2005: The FLUKA team has pointed out that
the ne
energy
spectrum as plotted below is wrong. On the other hand, the ratios of CC
rates are correct. |